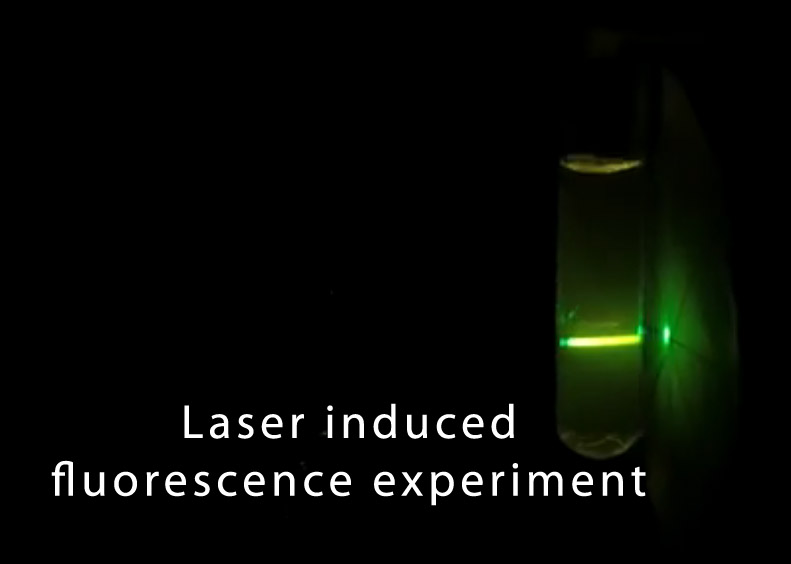
In the experiment, we are using 3 types of lasers: red 650 nm, green 532 nm, blue 450 nm. Here we used various concentrations of chlorophyll and fluorescein and olive oil as fluorescence liquids. As a bonus, we used glow sand with fluorescence and phosphorescence.
What is fluorescence?
Absorption of short-λ light that is subsequently re-emitted as longer-λ light
http://apps.usd.edu/coglab/schieber/nas/fluorence/sld003.htm
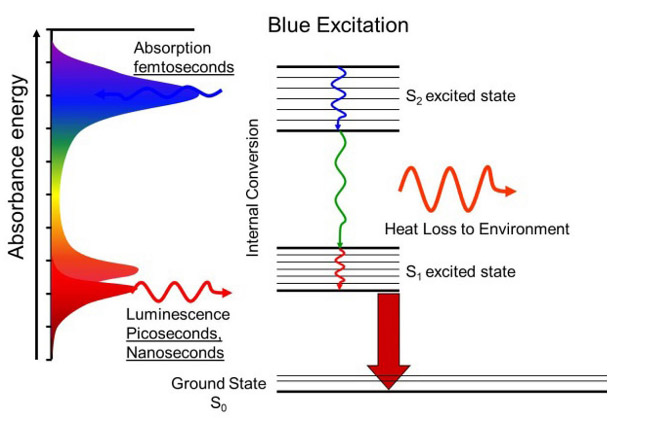
Molecules have many types of energy levels and all of them can be excited by absorbing photons. Two common energy levels are electronic, where the electrons get excited into higher energy levels, and vibrational, where molecules get excited into different types of vibrations. The energy difference in electronic levels is usually in the UV and/or visible, while the energy difference in vibrational levels is usually in the IR, which is much lower in energy. This means that, within each electronic level, there can be a ground vibrational state and several excited vibrational states. this is represented schematically on the left. S0 is the ground electronic state and it has six vibrational states, represented by 0, 1, 2, … . S1 is the excited electronic state and also has six vibrational states. When a molecule absorbs a photon and gets excited to a higher electronic state, it can also be excited into a higher vibrational state. The molecule can then relax into the ground vibrational state of the excited electronic state (S1-0) without emitting radiation. Now, when the molecule relaxes to the ground electronic state, it emits a photon of lower energy in any direction. This is called fluorescence. In the schematic, a UV photon (represented as purple) was absorbed and a green photon was emitted. “But which vibrational state in the ground electronic state does the molecule relax to?” In the schematic, it relaxed to state 2, but any state is possible. In fact, in an experiment where many molecules are excited, all possible relaxations will happen. This creates a fluorescence spectrum that can be used for identification.
What is the Jablonski Diagram?
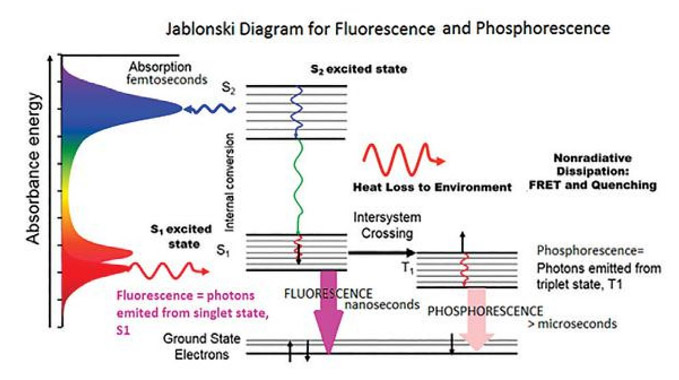
Fig : Jablonski diagram for Phosphorescence emission
Fig shows the Jablonski diagram (Jablonski, 1933), a schematic of the transition of electronic state of a molecule during the fluorescence phenomenon. The left axis shows increasing energy, where a typical fluorescent molecule has an absorbance spectrum. This spectrum shows the energy or wavelengths, where the molecule will absorb light.
If the incident light is at a wavelength where the molecule will absorb the photon, the molecule is then excited from the electronic ground state to a higher excited state, denoted S2 here.
The electrons then go through internal conversion, affected by vibrational relaxation and heat loss to the environment. It then emits a photon from the lowest-lying singlet excited state in the form of fluorescence.
In conventional fluorescence, photons are emitted at higher wavelengths than the photons that are absorbed. This diagram is extremely important to understanding fluorescence. When measuring a fluorescence spectrum, one is typically looking at the intensity at which a molecule emits, the wavelength or energy at which it emits, and also the time which the molecule spends in the excited state. This is the fluorescence lifetime, explained further in detail in the coming sections.
Any number of things can affect these observables, including energy transfer to and from other molecules, quenching by other molecules, temperature, pH, local polarity, aggregation or binding. Understanding the mechanisms of these interactions can give us insight into what is being observed with a change in fluorescence spectra or lifetime.
There are two non-radiative deactivation processes that compete with fluorescence: internal conversion from the lowest singlet excited to the ground state and intersystem crossing from the excited singlet state to the triplet state. This last process leads to a phenomenon called phosphorescence, explained in further detail later on.
What is phosphorescence?
Phosphorescence is a process where the photon is emitted, not from a singlet-excited state, but from a forbidden triplet state. The time scale of emission is generally in the picosecond to nanosecond range, while phosphorescence typically lasts for fluorescence microseconds, milliseconds, or even longer…minutes or hours. Researchers typically use a pulsed source such as a flash lamp or LED to measure phosphorescence spectra and decays on these longer time scales. Phosphorescence measurements use a longer-lived pulsed source, such as a xenon flash lamp. The timing of the flashing lamp can be used to measure spectra at different phosphorescence lifetimes.
Phosphorescence measurements use a longer-lived pulsed source, such as a xenon flash lamp. The timing of the flashing lamp can be used to measure spectra at different phosphorescence lifetimes.
Preparing samples for the experiment
Chlorophyll was extracted like in this video
https://www.youtube.com/watch?v=f0h3UKuwyrw
Fluorescein was extracted like in this video https://www.youtube.com/watch?v=Y6YoP08M8lo
Fluorescent Bright Glow-in-the-Dark Sand Particles was bought on the eBay
Extra virgin olive oil is from my kitchen 🙂
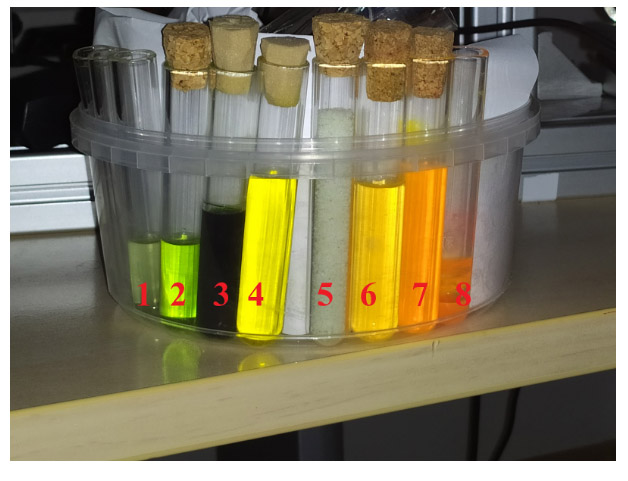
Prepared test tubes.
- Low concentration chlorophyll
- Medium concentration chlorophyll
- High concentration chlorophyll
- Olive oil
- Fluorescent Bright Glow-in-the-Dark Sand Particles
- Low concentration fluorescein liquid
- Medium concentration fluorescein liquid
- High concentration fluorescein liquid
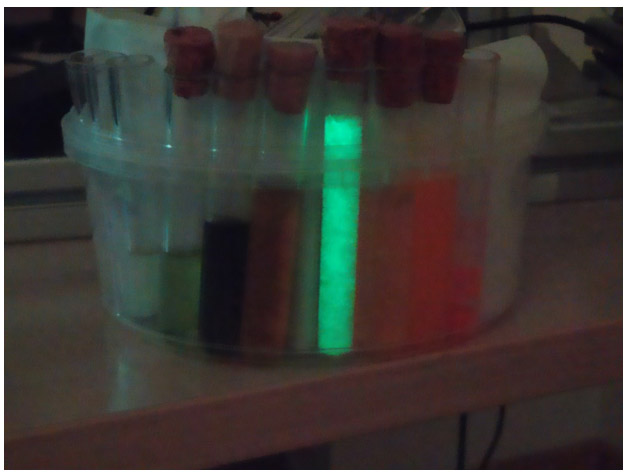
Test tubes after experiment, visible phosphorescence in the one sample
Multilaser bench
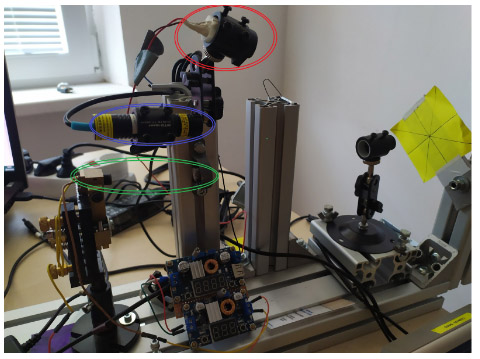
Fig. Multilaser bench. 3 different wavelengths -red 650nm (red ellipse), Blue 450 nm (blue ellipse), and green DPSS 532nm (green ellipse)
Red laser
This laser is not making fluorescence at any sample. The beam is visible in the chlorophyll and fluorescein.
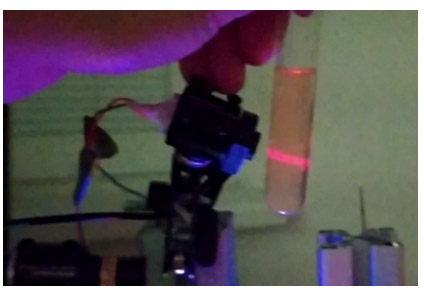
Red laser beam visible in the fluorescein
Blue laser
The blue laser is making fluorescence at all samples.
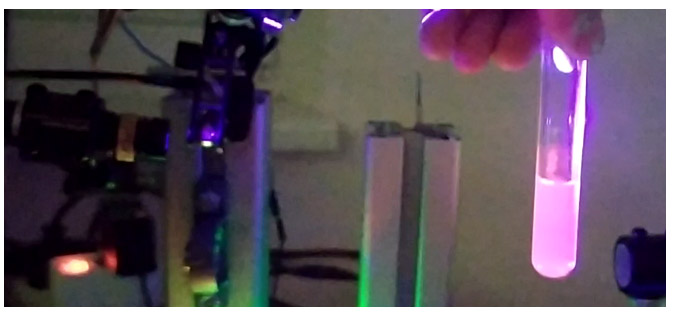
Fluorescence of chlorophyll
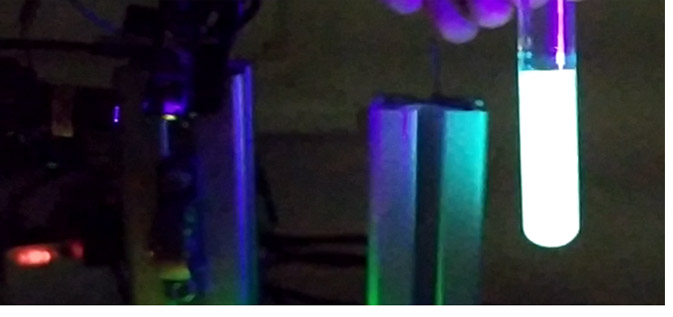
Fluorescence of fluorescein
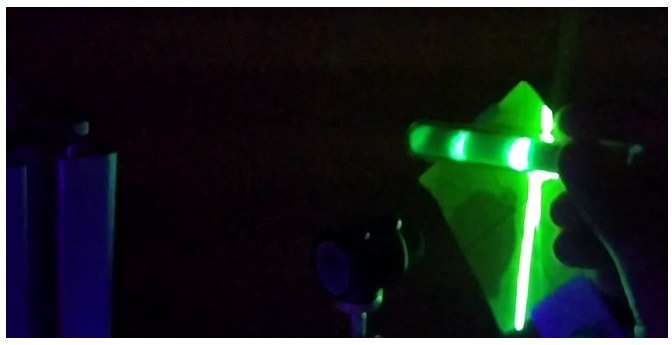
Glow sand have fluorescence
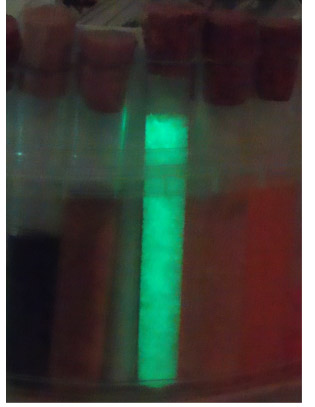
Afterglow phosphorescence of sample
Green laser
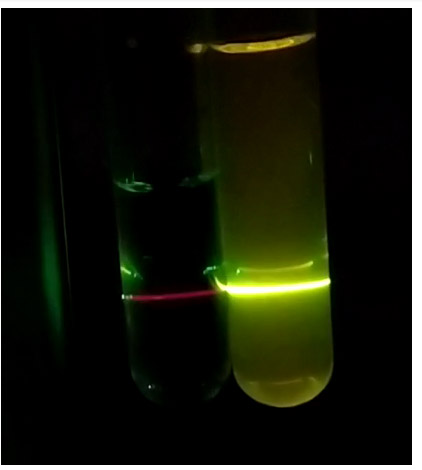
Fluorescence of chlorophyll (left) and fluorescein (right)
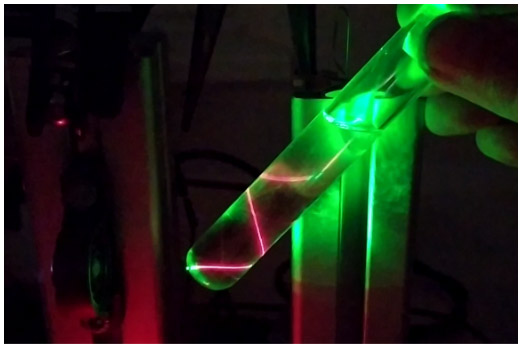
Fluorescence in the olive oil
Written by Dr. Kajan Juraj
